Chemical reactions are of two types
1.Irreversible reaction
2. Reversible reaction – it’s of two types
a. homogeneous
b. heterogeneous
A. homogeneous reversible reaction
B.heterogeneous reversible reaction — its behaviour can be studied by PHASE RULE given by Willard Gibbs (1874).
Phase rule
The number of degree of freedom (F) of the system is related to number of components (C) and number of phases (P) by the following phase rule equation.
F = C-P+2
Explanation or meaning of terms 1. Phase (P)
Any homogeneous physically distinct and mechanically separable portion of a system which is separated from other parts of the system by definite boundaries.
a. Gaseous phase
All gases are completely miscible and there is no boundary between one gas and the other. For example: air – single phase
b.Liquid phase
It depends on the number of liquids present and their miscibilities.
i. If two liquids are immiscible, they will form three separate phases two liquid phase and one vapour phase. For example: benzene-water.
ii. If tow liquids are miscible, they will form one liquid phase and one vapour phase. For example: alcohol – water.
C .Solid phase
Every solid constitutes a separate phase
For example:
(i) Water system ——- three phases
(ii) Rhombic sulphur (s) — > monoclinic sulphur (s) —– two phase
(iii) Sugar solution in water —– one phase
(iv) CuSO4.5H2O(s) < — — > CuSO4.3H2O(s) + 2H2O(g) —- three phases.
2. Component (C)
“The smallest number of independently variable constituents, by means of which the omposition of each phase can be expressed in the form of a chemical equation”.
For example:
· Water system —- one component ( H2O )
· An aqueous system of NaCl — two component ( NaCl , H2O )
· PCl5(s) < — — > PCl3 (l) + Cl2 (g) — two component ,three phases
· CuSO4.5H2O(s) < — — > CuSO4.3H2O(s) + 2H2O(g) —- three phases,two
3. Degree of freedom(F)
“The minimum number of independent variable factors such as temperature, pressure and concentration, which much be fixed in order to define the system completely”.
i) Water system
Ice (s) < — — > water (l) < — — > vapour (g)
F = Non variant (or) zero variant
ii) Ice (s) < — — > water (l)
F = univariant (one)
iii) For a gaseous mixture of N2 and H2, we must state both the pressure and temperature.
Hence,the system is bivariant.
PHASE DIAGRAM:
Phase diagram is a graph obtained by plotting one degree of freedom against another.
Types of phase diagrams
(i)P-T Diagram : used for one component system
(ii) T-C Diagram : used for two component system
APPLICATIONS OF PHASE RULE TO ONE COMPONENT SYSTEM The water system:
Water exists in three possible phases namely solid, liquid and vapour. Hence there
can be three forms of equilibria.
Solid < — — > Liquid
Liquid < — — > Vapour
Solid < — — > Vapour
Each of the above equilibrium involves two phases. The phase diagram for the water system is shown in the figure.
This phase diagram contains curves, areas, and triple.
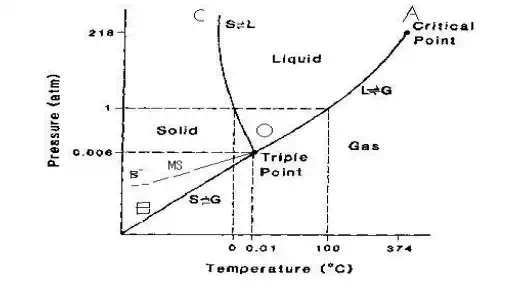
(i)Curve OA
The curve OA is called vaporisation curve, it represents the equilibrium between water and vapour. At any point on the curve the following equilibrium will exist.
Water < — — > Water vapour
The degree of freedom of the system is one, i.e, univariant.
This is predicted by the phase rule.
F=C-P+2; F=1-2+2; F=1
This equilibrium (i.e. Line OA) will extend up to the critical temperature (347o C). Beyond the critical temperature the equilibrium will disappear only water vapour will exist.
(ii) Curve OB
The curve OB is called sublimation curve of ice, it represents the equilibrium between ice and vapour. At any point on the curve the following equilibrium will exist.
ICE < — — > VAPOUR
The degree of freedom of the system is one, i.e. univariant. This is predicted by the phase rule.
F = C – P + 2; F = 1-2=2 ; F=1
This equilibrium (line OB) will extend up to the absolute zero (-273o C), where no vapour can be present and only ice will exist.
iii) Curve OC
The curve OC is called melting point curve of ice, it represents the equilibrium between the ice and water. At any point on the curve the following equilibrium will exist.
Ice < — — > water
The curve OC is slightly inclined towards pressure axis. This shows that melting point of ice decreases with increase of pressure.
The degree of freedom of the system is one i.e., univariant. iv) point O (triple point)
The three curves OA ,OB ,OC meet at a point “O” ,where three phases namely solid ,liquid and vapour are simultaneously at equilibrium .
This point is called triple point, at this point the following equilibrium will exist.
Ice < — — > water < — — > vapour

 The degree of freedom of the system is zero i.e., nonvariant.This is predicted by the phase rule. F=C-P+2; F=1-3+2=0
Temperature and pressure at the point “O” are 0.0075 oC and 4.58 mm respectively.
(v) Curve OB’: Metastable equilibrium
The curve OB’ is called vapour pressure curve of the super-cool water or metastable equilibrium where the following equilibrium will exist.
Super-cool water < — — > vapour
Sometimes water can be cooled below O oC without the formation of ice, this water is called super –cooled water. Super cooled water is unstable and it can be converted in to solid by seeding or by slight disturbance.
vi) Areas
Area AOC, BOC, AOB represents water, ice and vapour respectively .The degree of the freedom of the system is two.i.e. Bivariant.
This is predicted by the phase rule
F=C-P=2; F=1-1+2; F=2
Two component alloy system or multi component equilibria Reduced phase rule or condensed system
The system in which only the solid and liquid are considered and the gas phase is ignored is called a condensed system.since pressure kept constant, the phase rule becomes
F’ = C – P + 1
This equation is called reduced phase rule.
Classification of two component system
Based on the solubility and reactive ablity, the two component systems are classified in to three types.
1. Simple eutectic formation – A binary system consisting of two substances, which arecompletely miscible in the liquid state, but completely immiscible in the solid state, is known as eutectic (easy melt) system. They do not react chemically. Of the different mixtures of the two substances, the mixture having the lowest melting point is known as the eutectic mixture.
2. a) formation of compound with congruent melting point
b) Formation of compound with incongruent melting point
3. Formation of solid solution
Thermal analysis or cooling curve
Thermal analysis is a method involving a study of the cooling curves of various compositions of a system during solidification. The form of the cooling curve indicates the composition of the solid.
Ex: 1. Cooling curve of a pure solid. Ex: 2. Cooling curve of a mixture A + B.
A cooling curve is a line graph that represents the change of phase of matter, typically from a gas to a solid or a liquid to a solid.
The independent variable (X-axis) is time and the dependent variable (Y-axis) is temperature. Below is an example of a cooling curve.
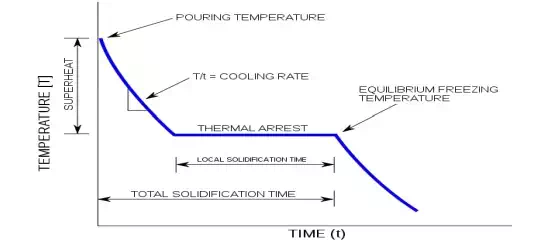
The initial point of the graph is the starting temperature of the matter, here noted as the “pouring temperature”. When the phase change occurs there is a “thermal arrest”, that is the temperature stays constant. This is because the matter has more internal energy as a liquid or gas than in the state that it is cooling to. The amount of energy required for a phase change is known as latent heat. The “cooling rate” is the slope of the cooling curve at any point.
A Pure substance in the fused or liquid state is allowed to cool slowly. The temperature is noted at different times.when represented graphically the rate of cooling will be a continuous from ‘a’ to ‘b’.
When the freezing point is reached and solid making its appearance there will be a break in the continuity of the cooling curve.The temperature will thereafter remain constant until the liquid is completely solidified.Thereafter the fall in temperature wil again become continuous.
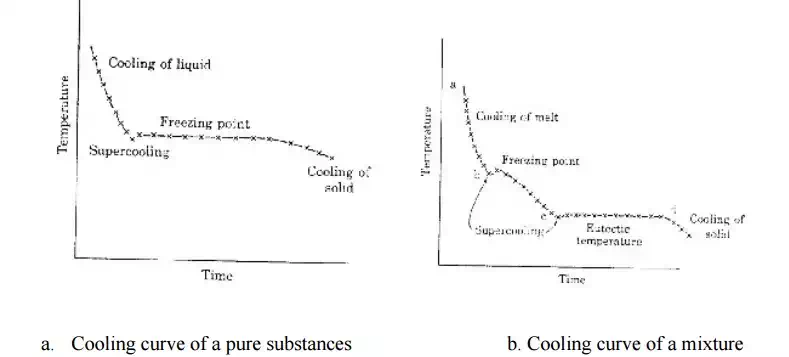
a. Cooling curve of a pure substances b. Cooling curve of a mixture
If a mixture of two solids in the fused state is cooled slowly we get a cooling curve .
Here also first a continuous coling curve will be obtained as long as the mixture is in the liquid state .
When a solid phase begins to form there will be a break in the cooling curve .But the temperature will not remain constant unlike in the case of cooling of a purified substance.The temperature will decrease continuously but at a different rate.The fall of temperature will continue till the mixture forms a eutectic and the eutectic point is reached.
The temperature will thereafter remain constant until solidification is complete . Thereafter the fall of temperature will become uniform ,but the rate of fall will be different from that for a pure substance.
Uses of cooling curves
· Percentage purity of the compounds can be noted from the cooling curve.
· The behaviour of the compounds can be clearly understood from the cooling curve.
· The procedure of thermal analysis can be used to derive the phase diagram of any two component system.
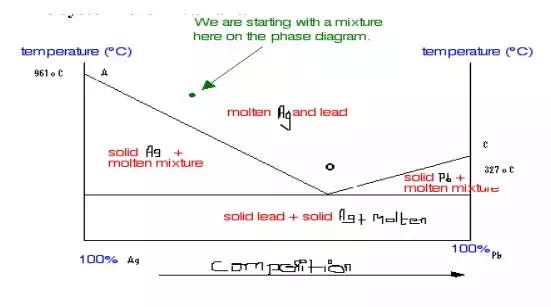
BINARY ALLOY SYSTEM OR THE SIMPLE EUTECTIC SYSTEM The Lead – Sliver system
Since the system is studied at constant pressure,the vapour phase is ignorned and the condensed phase rule is rule is used.
F I= C-P+1
The phase diagram of lead –sliver system is shown in the figure It contains lines,areas and the eutectic point.
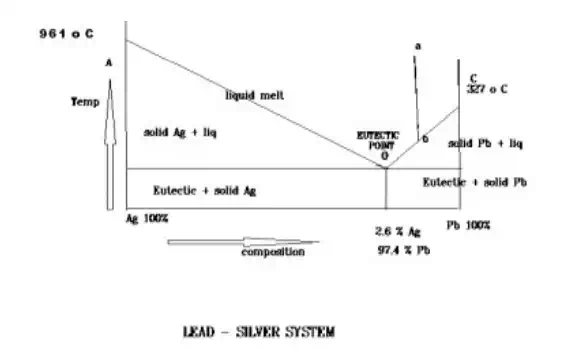
i) curve AO
The curve AO is known as freezing point curve of sliver.
Along the curve AO, solid Ag and the melt are in equilibrium.
Solid Ag < — — > melt
According to reduced phase rule
F’=C-P+1
C=2
P=2
F’=1
The system is univariant
ii) curve BO
The curve BO is known as freezing point curve of lead .
Along the curve BO, solid Pb and the melt are in equilibrium.
Solid Pb < — — > melt
According to reduced phase rule
F’=C-P+1
C=2
P=2
F’=1
The system is univariant.
iii) Point “ O ” (eutectic point)
The curves AO and BO meet at point ‘ O ‘ at a temperature of 303 o C ,where the three phases are in equilibrium.
Solid Pb + soild Ag < — — > melt
According to reduced phase rule
F’=C-P+1
C=2
P=3
F’=1
The system is non-variant.
The point “ O “ is called eutectic point or eutectic temperature and is corresponding composition,97.4 % Pb and 2.6 % Ag ,is called eutectic composition.below this point the eutectic compound and the metal solidfy.
iv) Areas
The area above the line AOB has a single phase( molten Pb + Ag ). According to reduced phase rule
F’=C-P+1 C=2
P=1
F’=2
The system is bi-variant.
The area below the line AO ,OB and point “O” have two phases and hence the system is univariant.
According to reduced phase rule F’=C-P+1
C=2
P=2
F’=1
The system is uni-variant.
The process of raising the relative proportion of Ag in the alloy is known as pattinson’s process.
The Pattinson process was patented in 1833. It depended on well-known material properties; essentially that lead and silver melt at different temperatures. The equipment consisted of a row of about 8-9 iron pots, which could be heated from below. Agentiferous lead was charged to the central pot and melted. This was then allowed to cool, as the lead solidified, it was skimmed off and moved to the next pot in one direction, and the remaining metal was then transferred to the next pot in the opposite direction. The process was repeated in the pots successively, and resulted in lead accumulating in the pot at one end and silver in that at the other. The process was economic for lead containing at least 250 grams of silver per ton.
Uses of eutectic system
1.suitable alloy composition can be predicted with the help of eutectic systems. 2.eutectic systems are used in preparing solders ,used for joining two metal pieces together.
Melting point
It is the temperature at which the solid and liquid phases, having the same composition ,are in
equilibrium.
Solid A < — — > solid B
Eutectic point
It is the temperature at which two solids and a liquid phase are in equilibrium.
Solid A + solid B < — —> Liquid
Triple point
It is the temperature at which three phases are in equilibrium.
Solid < — —> liquid < — —> vapour
 By definition ,
All the eutectic points are melting points, but all the melting points need not be eutectic points. ll ly , all the eutectic points are triple points ,but all the triple points need not be eutectic points.
Uses (or) merits of phase rule
1. It is a convenient method of classifying the equilibrium states in terms of phases ,components and degree of freedom.
2. It helps in deciding whether the given number of substances remain in equilibrium or not.
Limitations of phase rule
1.phase rule can be applied for the systems in equilibrium.
2.only three variables like P,T & C are considered ,but not electrical, magnetic and gravitational forces.

Comments are closed.