Resistivity logs are electrical well logs that record the resistivity of a formation. Resistivity is usually recorded in ohm meters (Ωm) and is displayed on track 4 of a well log.[1] Three depths of resistivity can be logged (shallow, medium, and deep) that record the resistivity of the formation with increasing distance away from the borehole. Resistivity logs can be interpreted to infer information about the porosity of a formation, the water saturation, and the presence of hydrocarbons.
Definition
Resistivity Logs are well logs that record the resistivity of a formation.
Resistivity is the property of a material that resists the flow of electrical current. The reciprocal of resistivity is conductivity. Resistivity is defined by the equation {\displaystyle

Where:
R is resistivity
r is resistance
A is cross-sectional area
L is length
The resulting unit of resistivity is ohm meters squared/meters or simply, ohm meters (Ωm).[2][1] Resistivity is an independent property of a material and does not vary with size or shape of the material sample.[2]
| Material | Relative Resistivity |
| Fresh water | high |
| Salt water (Brine) | low |
| Hydrocarbons | high |
| Sandstone | high |
| Limestone | high |
| Shale | low |
Resistivity Logging
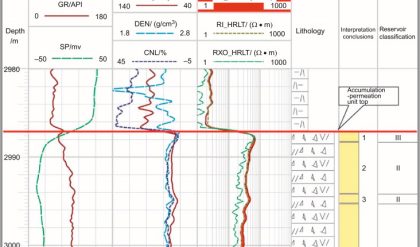
There are three main categories of well Logging: Electrical, Nuclear and Acoustic/Sonic.[2] Resistivity logging is an electrical well logging method and as such should be conducted in an open/uncased hole. Usually resistivity logs are displayed on track 4 of a well log and are displayed in ohm meter (Ωm) units[1] Resistivity logging was the first rock property that was logged and began the development of well logging methods.[2]
Diagram showing an induction tool, an SP log, and a resistivity log with medium resistivity, ILm, and deep resistivity, ILd. Image from Fig I-4 (Courtesy Schlumberger.)
Measurement & Tools
During logging, a current is produced within a formation and the formation’s response to the current is recorded. There are two ways that the current can be produced in the formation: i. directly applying a current into the formation, and ii. inducing a current in the formation. If a current is directly applied to the formation, then the resistance of the current over a length of formation is measured. If a current is induced in the formation, then the conductivity of the formation is measured and inverted for the resistivity.
Electrode tools are used to directly apply a current to the formation and measure the resistivity. Induction tools are used to induce a current in the formation and measure the conductivity. Induction tools are more widely used but a combination of electrode and induction tools can be used to create a single log of resistivity in the various zones of the formation. Electrode tools generally measure the shallow resistivity while induction tools generally measure the deep resistivity. Deep induction tools usually run in the frequency range of 35 – 20,000 Hz.
Measurement Zones

Diagram showing borehole, invaded zone, flushed zone, annulus, and uninvaded zone.
Resistivity logs are influenced by the fluid used during drilling. During drilling, the drilling mud seeps into the formation’s pores and displaces the original formation fluid. The solid particles of the mud line the walls of the borehole while the filtrate is pushed into the formation. This creates various zones around the borehole based on how far the drilling fluid has been pushed into the formation.[2]
The invaded zone is the area where the drilling fluid is present in the formation. The invaded zone is comprised of the flushed zone and the annulus zone.
The flushed zone is only a few inches into the formation from the borehole and all of the original formation fluid has been replaced by drilling filtrate. The resistivity in the flushed zone reflects the resistivity of the drilling filtrate. The flushed zone is logged as shallow depth resistivity
The annulus zone is the transition zone next to the flushed zone and has a mixture of the drilling filtrate and the original fluid. The resistivity of the annulus zone reflects a combination of the drilling filtrate and original fluid. The annulus zone is logged as medium depth resistivity
The uninvaded zone is the furthest zone from the borehole and has not had any drilling fluid enter it. The resistivity in the uninvaded zone is the true resistivity of the original fluid and formation. The uninvaded zone is logged as deep resistivity
Interpretation and Uses
Rock Properties
Resistivity can be interpreted as a measurement of a formation’s fluid saturation as it is a function of the formation’s rock type, porosity, fluid type, and fluid volume. Consequently, resistivity is used to identify permeable areas, estimate the porosity of a formation, and estimate fluid saturation. Archie’s equation can be used to calculate porosity and fluid saturation from resistivity logs.[2]
Hydrocarbon Indicators
One of the most useful applications of resistivity logs is identifying hydrocarbon saturation vs. water saturation in a formation. Also, by distinguishing between water and hydrocarbon saturation, resistivity logs can be used to identify oil-water contacts. The difference between drilling fluid and hydrocarbon resistivity can be used as a hydrocarbon indicator. In the case where drilling fluid has relatively low resistivity then sections of the log with shallow resistivity less than deep resistivity can be used as a hydrocarbon indicator. Archie’s equation can be used to calculate the oil saturation of a formation from resistivity logs.[2]
Archie’s Equation & Other Calculations
Archie’s equation can be used to calculate the porosity, water saturation, and oil saturation of sandstones and limestones from resistivity logs. Archie’s equation cannot be applied to shales.
To calculate the water saturation, Archie’s equation can be written:
To calculate the porosity in the flushed zone the following equation can be used:

However, for a hydrocarbon saturated rock this equation will underestimate the porosity and a correction needs to be applied to the equation. The corrected equation is:


Comments are closed.